Two views of the same reality

Management sees outcome metrics: cycle time trends, release cadence, defect rates, and structural health signals like external blockers growing, WIP creeping, and reactive work consuming capacity. They know when to offer support without needing to chase updates.

Through a Jira plugin, teams see the sprint-level detail that explains why: the blockers, the scope changes, the handoff delays, the tickets that took three times longer than expected and exactly where that time went. AI-powered analysis gives the team specific, evidence-based actions every sprint. Improvement happens in retrospectives, interactively inside Jira. No new tool to adopt. Not a dashboard report handed down to them.

Measure what matters. Let the team own it.
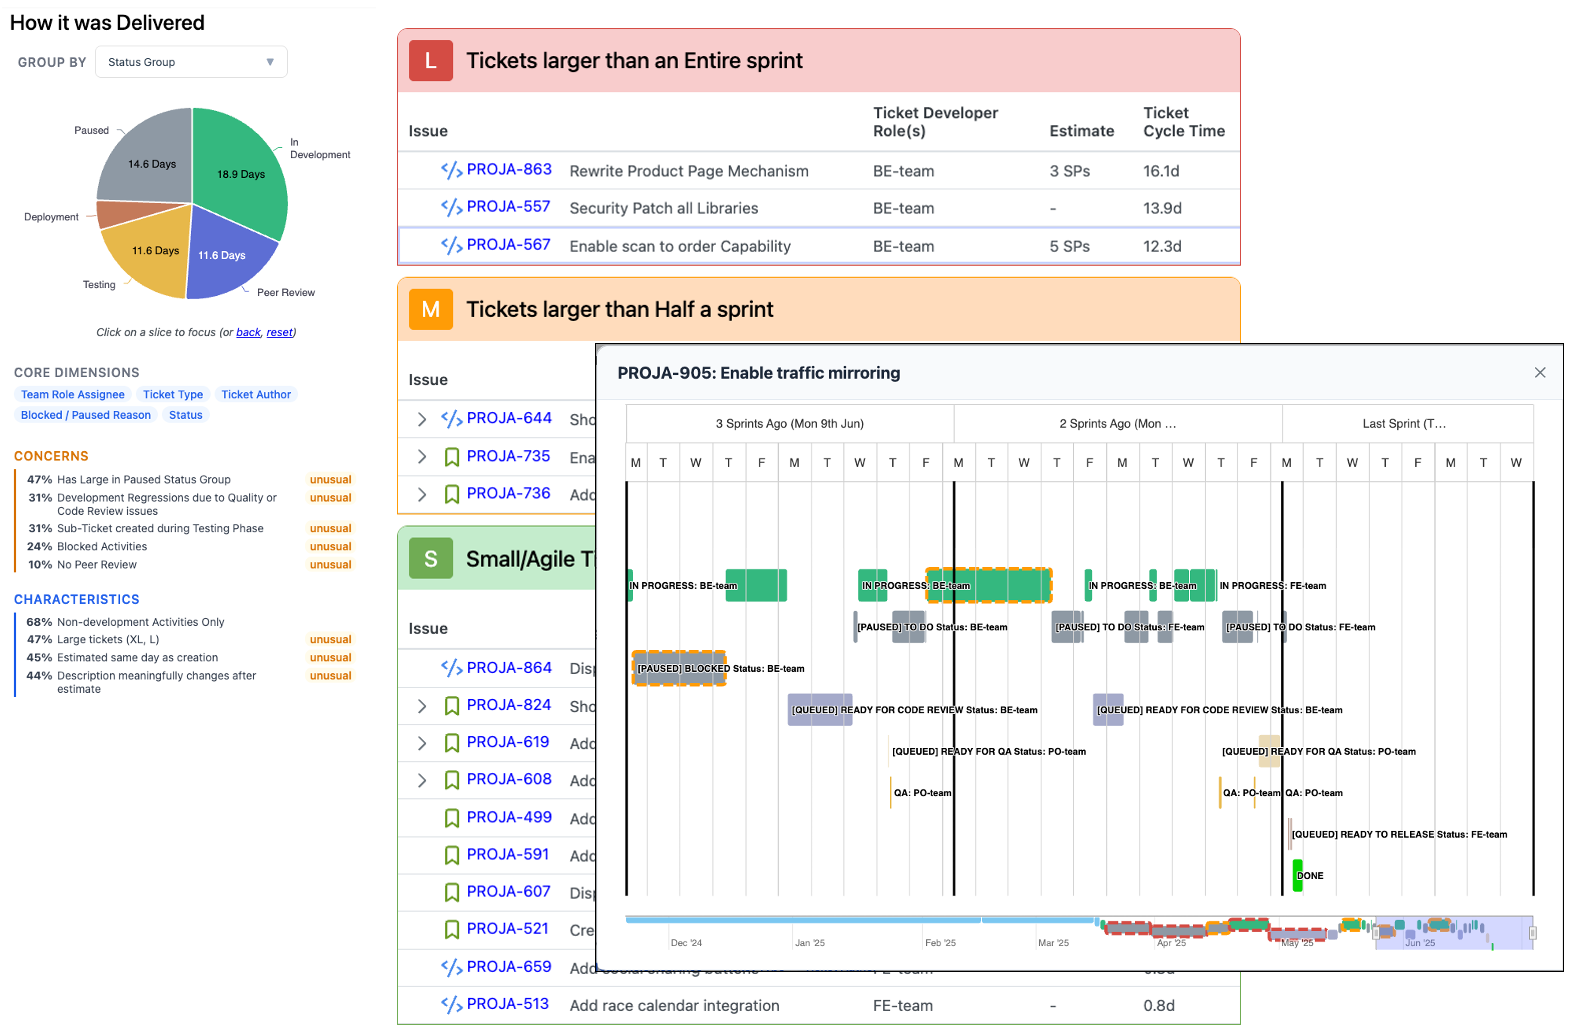
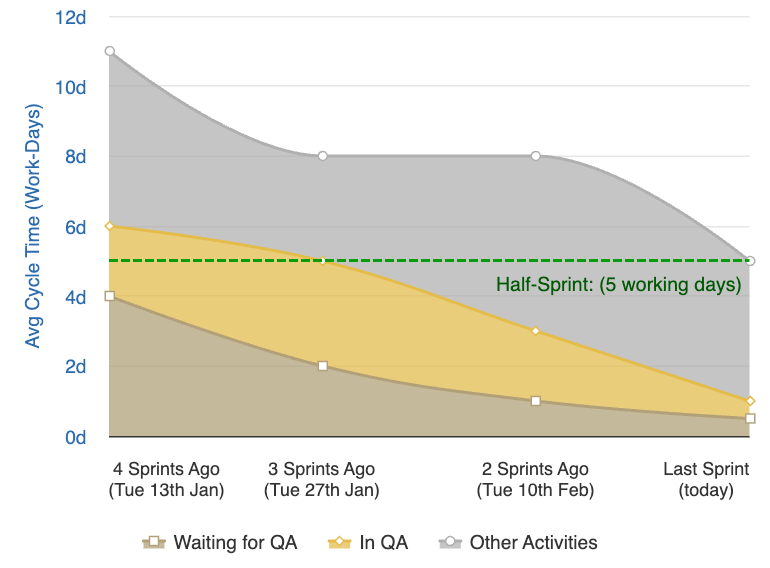
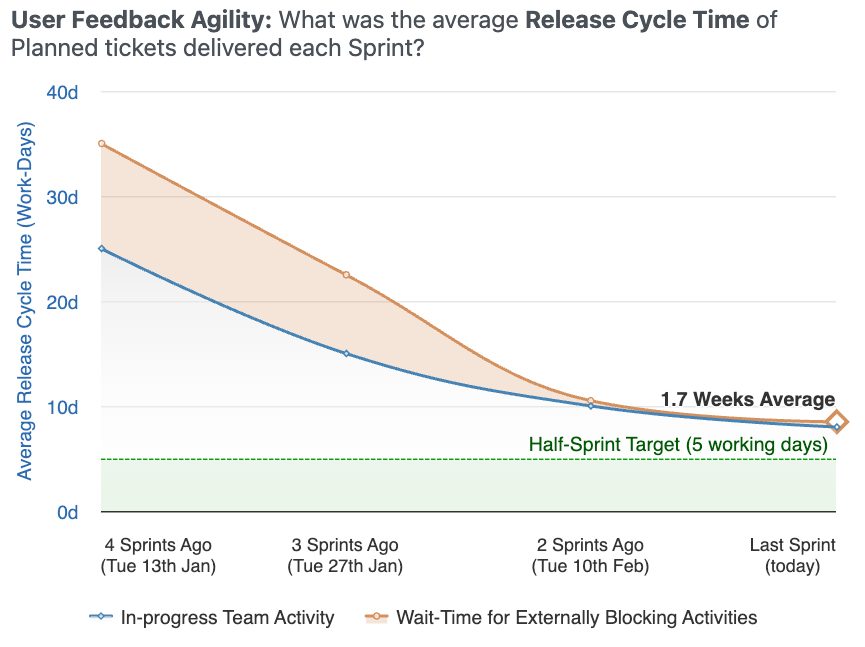
Release Cycle Time

Planned work shouldn't take more than half a sprint.
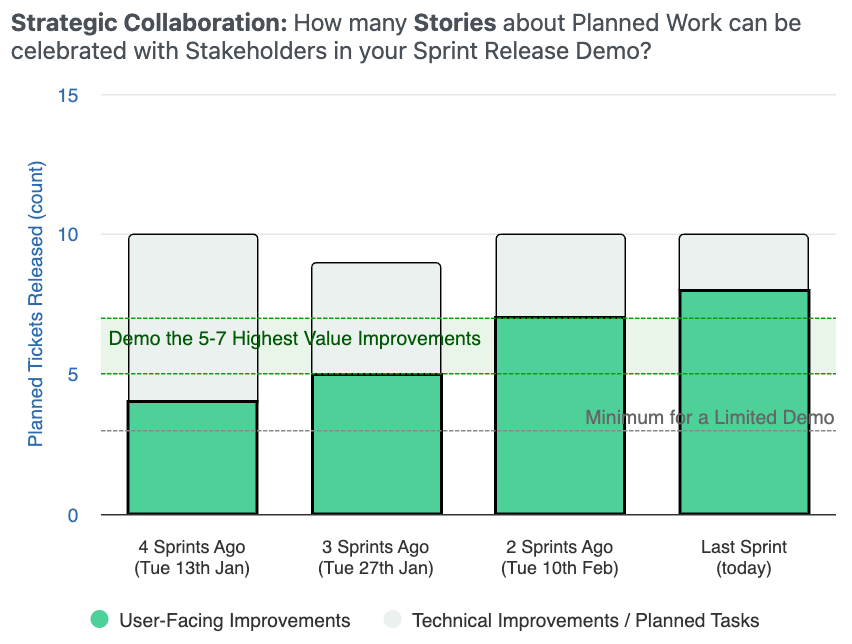
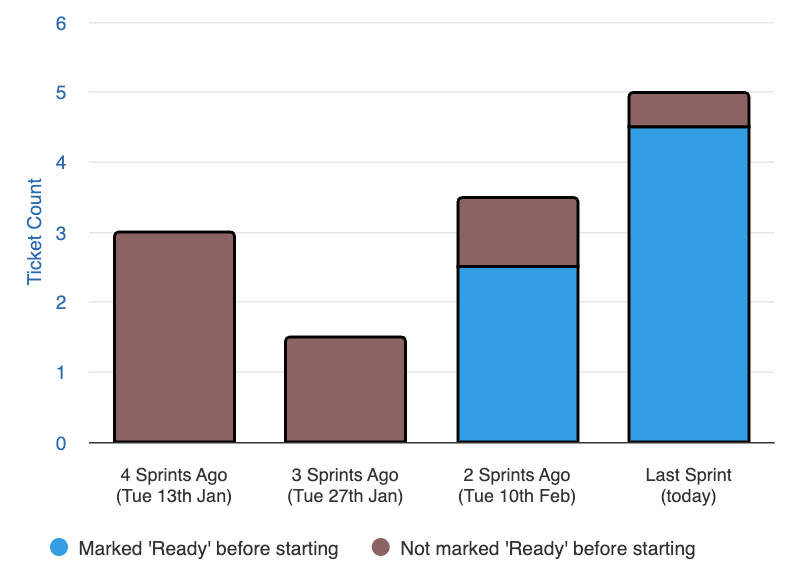
Tickets Released

Small, frequent releases are the foundation.

Defect Rate

Speed without quality creates more work, not less.

Defect Recovery Time

When something breaks, how fast does the team recover?

Release cycle time graph showing team activity vs external factors over sprints

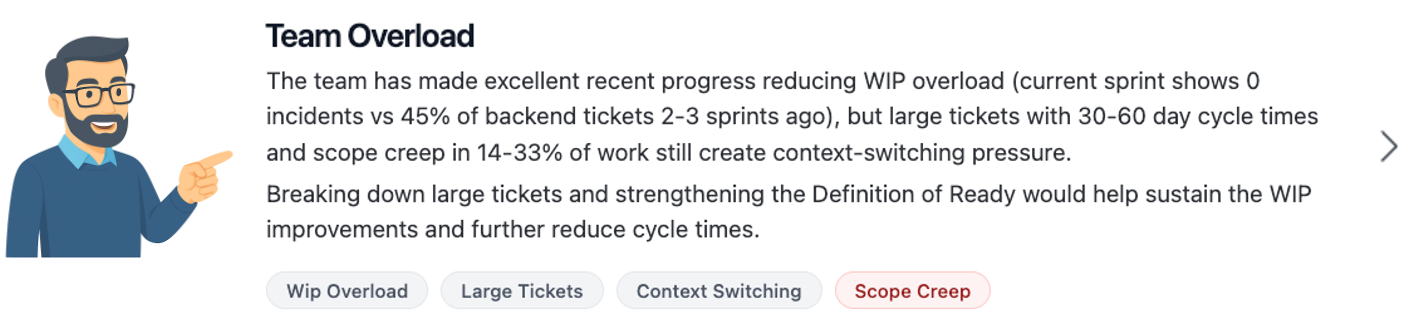
These four metrics balance each other. Optimising one at the expense of another always shows up. The only way through is to genuinely improve.

Recadence additionally monitors structural health indicators for engineering leaders: WIP creep, external blockers, reactive distractions, defect backlog build-up, unfinished carry-over, cancelled work. Signals to offer support, not surveillance.

Start with the biggest issues right now

Whether or not a team uses sprints for planning, they need to reflect regularly. Recadence dives into the tickets themselves: where time actually went, what was planned versus reactive, where work stalled. Slow pull requests, reversions from QA, mid-sprint scope changes, blocking dependencies outside the team.

The breakdown separates what the team controls from what they don't, so the conversation starts with evidence instead of defensiveness.

Sprint delivery breakdown showing where time goes across planned work, fixes, and blockers

From cycle time to root causes

Recadence correlates hundreds of behavioural signals across your last four sprints to find compound patterns. An LLM then distils the results into discussion prompts at multiple levels, so the team can zoom in where it matters.

Delivery problems repeat. Delays from large tickets in one sprint cause downstream bottlenecks in the next. The symptoms look different each time, but they share root causes. Recadence connects these patterns and shows teams where to focus.

Recadence surfaces tailored recommendations using the behavioural signals in your team's data - like having an expert coach in every retrospective, asking the right questions, with evidence instead of opinions.

The "yes, but how?" answers
  • Large Tickets: which are too big, who creates them, and what's driving it.
  • Planning: estimation accuracy, definition of ready, sprint commitment miss rates.
  • Testing & Automation: escaped defects consuming capacity, manual QA queues.
  • Workflow & CI/CD: code review time, deployment queues, batched releases.
  • Team Overload: WIP, context switching, scope creep.
  • Tech Debt: feature factory mode, ratio of planned technical work to reactive fixes.
  • External Factors: dependencies outside the team's control and their actual cost.

Example output: A real top-level summary for Team Overload:

AI-generated root cause explanation showing Team Overload analysis with actionable recommendations

Close the loop with the rest of the business

There's a reason teams resist sprint demos. Without short cycle times and visible blockers, demos become a stage where someone explains why nothing was released, or watches senior leadership argue about strategic issues the team can't control.

When cycle time is short, demos are fundamentally different. The team has finished, released work to show. External blockers are already measured and visible. The focus stays on the next minimum viable change, not on relitigating the last quarter. Trust built on cadence, not promises.

Sprint demo view showing completed stories and released work

From requests to results

"We need a month to rewrite all our code to use unit tests"
↓ becomes ↓
"QA have to manually re-test data exports every release. We automated that first, while waiting for user feedback. Cycle time went from 8 days to 5."

Cycle time as a team target means bottlenecks are where the biggest impact is. Teams separate what they control from what they don't. Instead of waiting for large technical investments to be prioritised, they slice a minimal fix, celebrate the result, and slice again. Improvements pay for themselves.

Cycle time improvement over time
Measurable improvement tracking showing before and after metrics

Jira only.

No code access. No repo permissions. We only read your Jira data.

5 minutes to first insight.

Connect, pick a team, see your sprints analysed.

Any methodology.

Scrum, Kanban, or something in between. It adapts to whatever it finds.

See the whole picture of your team's delivery

We'll connect your Jira on a quick setup call and walk you through your first analysis. Five minutes, your data, no slides.

Connect your data
Why it works