Step 1. See it: Measure what matters.

On a setup call we connect a read-only Jira user and pick the teams to review. Recadence maps your statuses, ticket types and team roles from the change history already in your tickets, and you verify the mapping. That is the whole configuration. The first thing you see is your own last quarter, not a demonstration. There is no dashboard to build first.

It loads invisibly at first, available only to management. Teams are introduced when you decide they should be, by adding the Jira plugin.

Everything is read from Jira change history: how work moved between statuses and how long it waited at each one. Every one of those moves was a decision the team made that day about what to prioritise. It is behavioural data, not individual activity data. Recadence doesn't look at how many commits or pull requests anyone produced along the way.

What the number is made of

If you only measure one thing, measure the cost of being delayed. Release Cycle Time is the working days from when a ticket first starts in progress until it is released. It counts working days because each workday is a priority decision, and weekends are usually not.

Once a ticket meaningfully starts, the clock doesn't stop, especially when it's blocked.

Cycle Time goes up when delivery is disrupted. It comes down when things improve. And it is resistant to gaming: the only way to sustainably reduce it is to release more often, making priorities more transparent.

This metric reflects team outcomes, not individual performance. Individual names aren't used in reports; team roles are used instead (e.g. "QA" or "Front-end Developer").
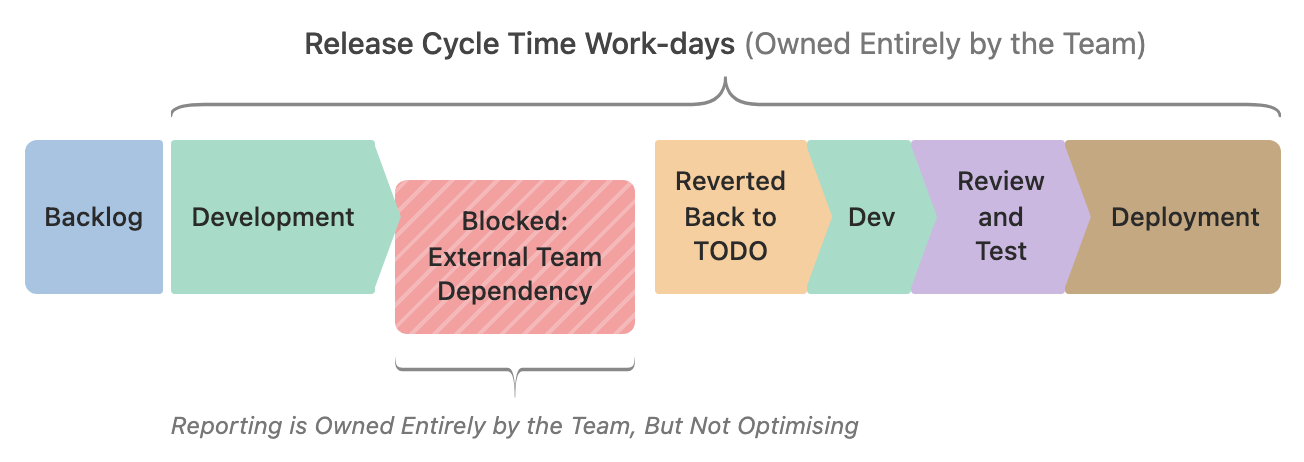
A ticket's path drawn as a row of seven blocks: Backlog, then Development, then a striped red block for Blocked: External Team Dependency, then Reverted Back to TODO, Dev, Review and Test, and Deployment. A brace over everything from Development to Deployment is labelled Release Cycle Time Work-days, owned entirely by the team. A second brace under the Blocked block alone is labelled Reporting is owned entirely by the team, but not optimising.

The days spent waiting on another team are included in the count. So are the days after the ticket was reverted to To Do, and the days it sat between review and test. From a team outcome perspective, once work has meaningfully started, all of that time is delivery capacity being consumed. If the number left the external block out, it would say the ticket took less time than it did, and the team would have no evidence of what that dependency cost them.

Four metrics that balance each other

Release Cycle Time

Planned work shouldn't take more than half a sprint.

Tickets Released

Small, frequent releases are the foundation.

Defect Rate

Speed without quality creates more work, not less.

Defect Recovery Time

When something breaks, how fast does the team recover?

These four DORA-influenced metrics balance each other. Optimising one at the expense of another always shows up. The only way through is to genuinely improve.

Signals to offer support, not surveillance

Underneath the four, Recadence tracks over a hundred behavioural facets of how each team's work moves. Engineering leaders are shown a small set of them as structural health indicators: WIP creep, external blockers growing, reactive work consuming capacity, defect backlog build-up, unfinished carry-over, cancelled work. They tell you when something needs attention, so you know when to step in and offer a team support without chasing updates or depending on self-reporting.

Some teams measure themselves against industry benchmarks, but every team, every project and every company is a different situation. The most useful benchmark is how the team itself has performed so far, because that is the one it can continuously improve against. Recadence builds that baseline from the history already in your Jira, in one pass, for every team you point it at. It is the basis on which the impact of AI adoption, a change in team structure or hypergrowth can be measured, particularly against risk thresholds.

If a diagnostic is all you need, this first step is enough on its own. The next two are for when a team wants to improve on the evidence in front of them.
Step 2. Prove it: Every number is computed before anything is written about it.

As a catch-all metric, cycle time needs to be explainable. Every figure in Recadence is derived from the status history of the tickets behind it, deterministically, and every figure opens into those tickets. Teams can drill from a summary finding down to individual tickets. If you don't believe a number, open it and find a ticket you remember. Its timeline shows where its days went, status by status.

Start with the biggest issues right now

Whether or not a team uses sprints for planning, all teams need to reflect regularly in order to improve. Each interval, Recadence dives into the tickets themselves: where time actually went, what was planned versus reactive, where work stalled, and what each delay cost. Slow pull requests, reversions from QA, mid-sprint scope changes, blocking dependencies outside the team.

The breakdown separates what the team controls from what they don't, so the conversation starts with evidence instead of defensiveness.

From cycle time to root causes

Delivery problems usually repeat. Delays from large tickets in one sprint cause downstream bottlenecks in the next. The symptoms look different each time, but they share root causes. Recadence correlates hundreds of behavioural signals across your last four sprints to find the compound patterns, and every candidate cause is ranked by how much of the lost time it accounts for and how sure the evidence is.

The "yes, but how?" answers, by area
  • Large tickets: which are too big, who creates them, and what's driving it.
  • Planning: estimation accuracy, definition of ready, sprint commitment miss rates.
  • Testing and automation: escaped defects consuming capacity, manual QA queues.
  • Workflow and CI/CD: code review time, deployment queues, batched releases.
  • Team overload: WIP, context switching, scope creep.
  • Tech debt: feature factory mode, ratio of planned technical work to reactive fixes.
  • External factors: dependencies outside the team's control and their actual cost.
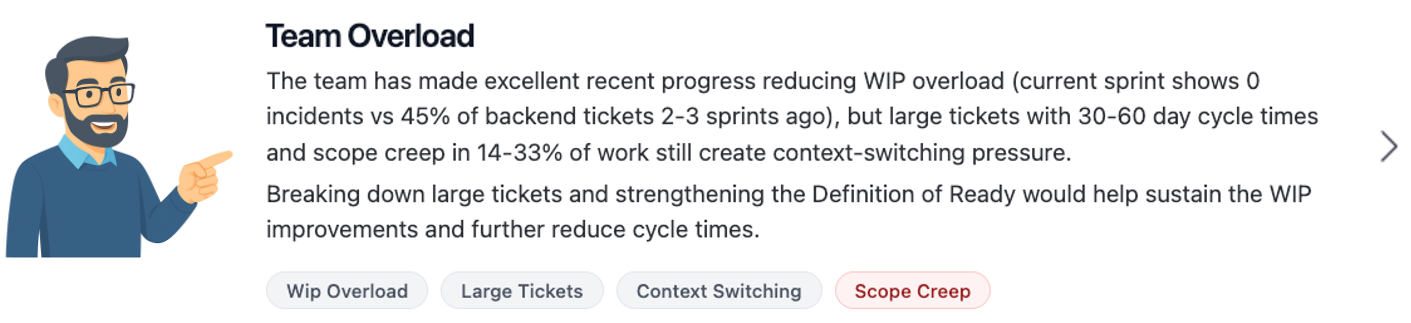
A top-level summary for Team Overload: the team has made recent progress reducing WIP overload, but large tickets with 30 to 60 day cycle times and scope creep in 14 to 33 per cent of work still create context-switching pressure; breaking down large tickets and strengthening the Definition of Ready would help sustain the improvement. Four tags follow: WIP overload, large tickets, context switching, scope creep.
A real top-level summary for Team Overload.

Where the AI comes in

Most teams don't value an AI analysis whose observations change every time it's asked. In Recadence, the findings don't come from an AI LLM. Every count, share and ranking above is computed deterministically from ticket history, and produces consistent, statistically defensible findings. When AI is enabled, that analysis is already finished before the AI sees it. What the AI does is summarise the results into discussion prompts at three depths: a top-level summary like the one above, a two-minute brief for each focus area with recommendations specific to the team's data, and underneath that a 10–15 minute guide with the predictive analytics and the relevant theory, in context with the team's actual problem rather than a list of books to read.

The AI summarises and explains; it doesn't invent. Nothing appears in a summary that isn't in the numbers beneath it. Your ticket descriptions and comments are never sent to an AI provider. The only data transmitted is anonymised operational metadata, and if you'd prefer, AI summarisation can be switched off altogether.

"Yes, but…"

Tell a team to make their tickets smaller and you'll hear: "Yes, but releasing wastes too much time." "Yes, but QA is the real bottleneck." "Yes, but the other team blocks us." They're usually right. And that's exactly the point. Each "yes, but" is a bottleneck, and the analysis above measures it, with the evidence to answer it every sprint. That's why our company is called Yes But How.

Not every team starts in the same place, and the analysis finds different things depending on where a team is. Where planning is broken, it points at work that was never ready and estimates that were never tested, because the basics have to come before cycle time optimisation makes sense. Where tickets are large but the team has the discipline and capability to change, it shows them where the time went inside the tickets that outgrew the sprint, and they fix it. Where a team is already working in small tickets, it finds the queues between them: code review, test, release batches. A blanket approach will fail. Recadence shows you which teams need what, across your entire portfolio, without depending on self-reporting.

Step 3. Scale it: Let the team own it.

What your teams can measure, you can delegate. The same analysis is available to the team inside Jira, on the ticket and from the board and backlog menus, and it respects the Jira permissions they already have. No external tool, no second login.

In the retrospective

Recadence is designed to be used in retrospectives, not stared at on a wall. Teams are sometimes given an adjustment period first, a window where the focus is on understanding the data rather than acting on the numbers. After that, retrospectives run on three principles.

  • Team retrospectives focus on delivered outcomes. Stories and tasks released, before bugs and reactive distractions. What activities added value, and what was anti-work?
  • Collaboration bottlenecks first. Not just between engineers, but with product management, users, and stakeholders. When engineering issues undermine these relationships, fixing them has tangible ROI.
  • One thing at a time. The team agrees on the smallest improvement worth testing. If it works, cycle time goes down in the next sprint. If it doesn't, cycle time goes up or carry-over builds, and that's okay, because it failed fast. Celebrate it in the demo and do it again.

The target

The target is an average Release Cycle Time of less than half a sprint, for most teams roughly a week, reached by optimising the team's own bottlenecks in retrospectives. The threshold exists because if work routinely takes longer than half a sprint, the team can't reflect, adapt and improve within a retrospective cycle. A team can't sustain short cycle times without fixing the structural problems underneath: slow deployments, manual QA bottlenecks, poor planning, hidden dependencies, unclear requirements. Every one of these shows up as friction. And if a team improves cycle time at the expense of quality, the defect rate will show it.

Close the loop with the rest of the business

There's a reason teams resist sprint demos. Without short cycle times and visible blockers, demos become a stage where someone explains why nothing was released, or watches senior leadership argue about strategic issues the team can't control.

When cycle time is short, demos are fundamentally different. The team has finished, released work to show, and the rule is to only present work that is live in production, never work that is "almost finished". External blockers are already measured and visible. The focus stays on the next minimum viable change, not on relitigating the last quarter. Trust built on cadence, not promises.

"We need a month to rewrite all our code to use unit tests."
↓ becomes ↓
"QA have to manually re-test data exports every release. We automated that first, while waiting for user feedback. Cycle time went from 8 days to 5."

Cycle time as a team target means bottlenecks are where the biggest impact is. Teams separate what they control from what they don't. Instead of waiting for large technical investments to be prioritised, they slice a minimal fix, celebrate the result, and slice again. Improvements pay for themselves.

What changes

Transparency, not predictability

Agile doesn't make delivery predictable. It makes it transparent. When cycle times are short, scope changes become cheap course-corrections instead of expensive surprises. "When will it be done?" becomes "what should we focus on next?"

Evidence for problems the team can't control

External blockers, cross-team dependencies, and reactive distractions become measured and visible. Teams can show exactly what's within their control and what isn't. The conversation shifts from blame to support.

Improvement the team owns

When QA wait times halve because the team invested in automation, the before and after are right there. Improvement stops being theoretical.

Demos that aren't terrifying

Released work to show every interval, and leadership reporting that gets easier as the increments get smaller.

See the whole picture of your team's delivery

We'll connect your Jira on a quick setup call and walk you through your first analysis. Five minutes, your data, no slides.

Start free trial